
You work at one location. Most tools hand you a generic checklist instead of one built for you.
Log into a typical project tool at a single property, and you get everything: tasks meant for other locations, departments you don't touch, projects that closed months ago. You spend the first five minutes of every login figuring out what's actually yours before you can do anything about it. That is not a home page. That is a filter you have to build yourself, every single time. Pacer builds it once, automatically: Dashboard.
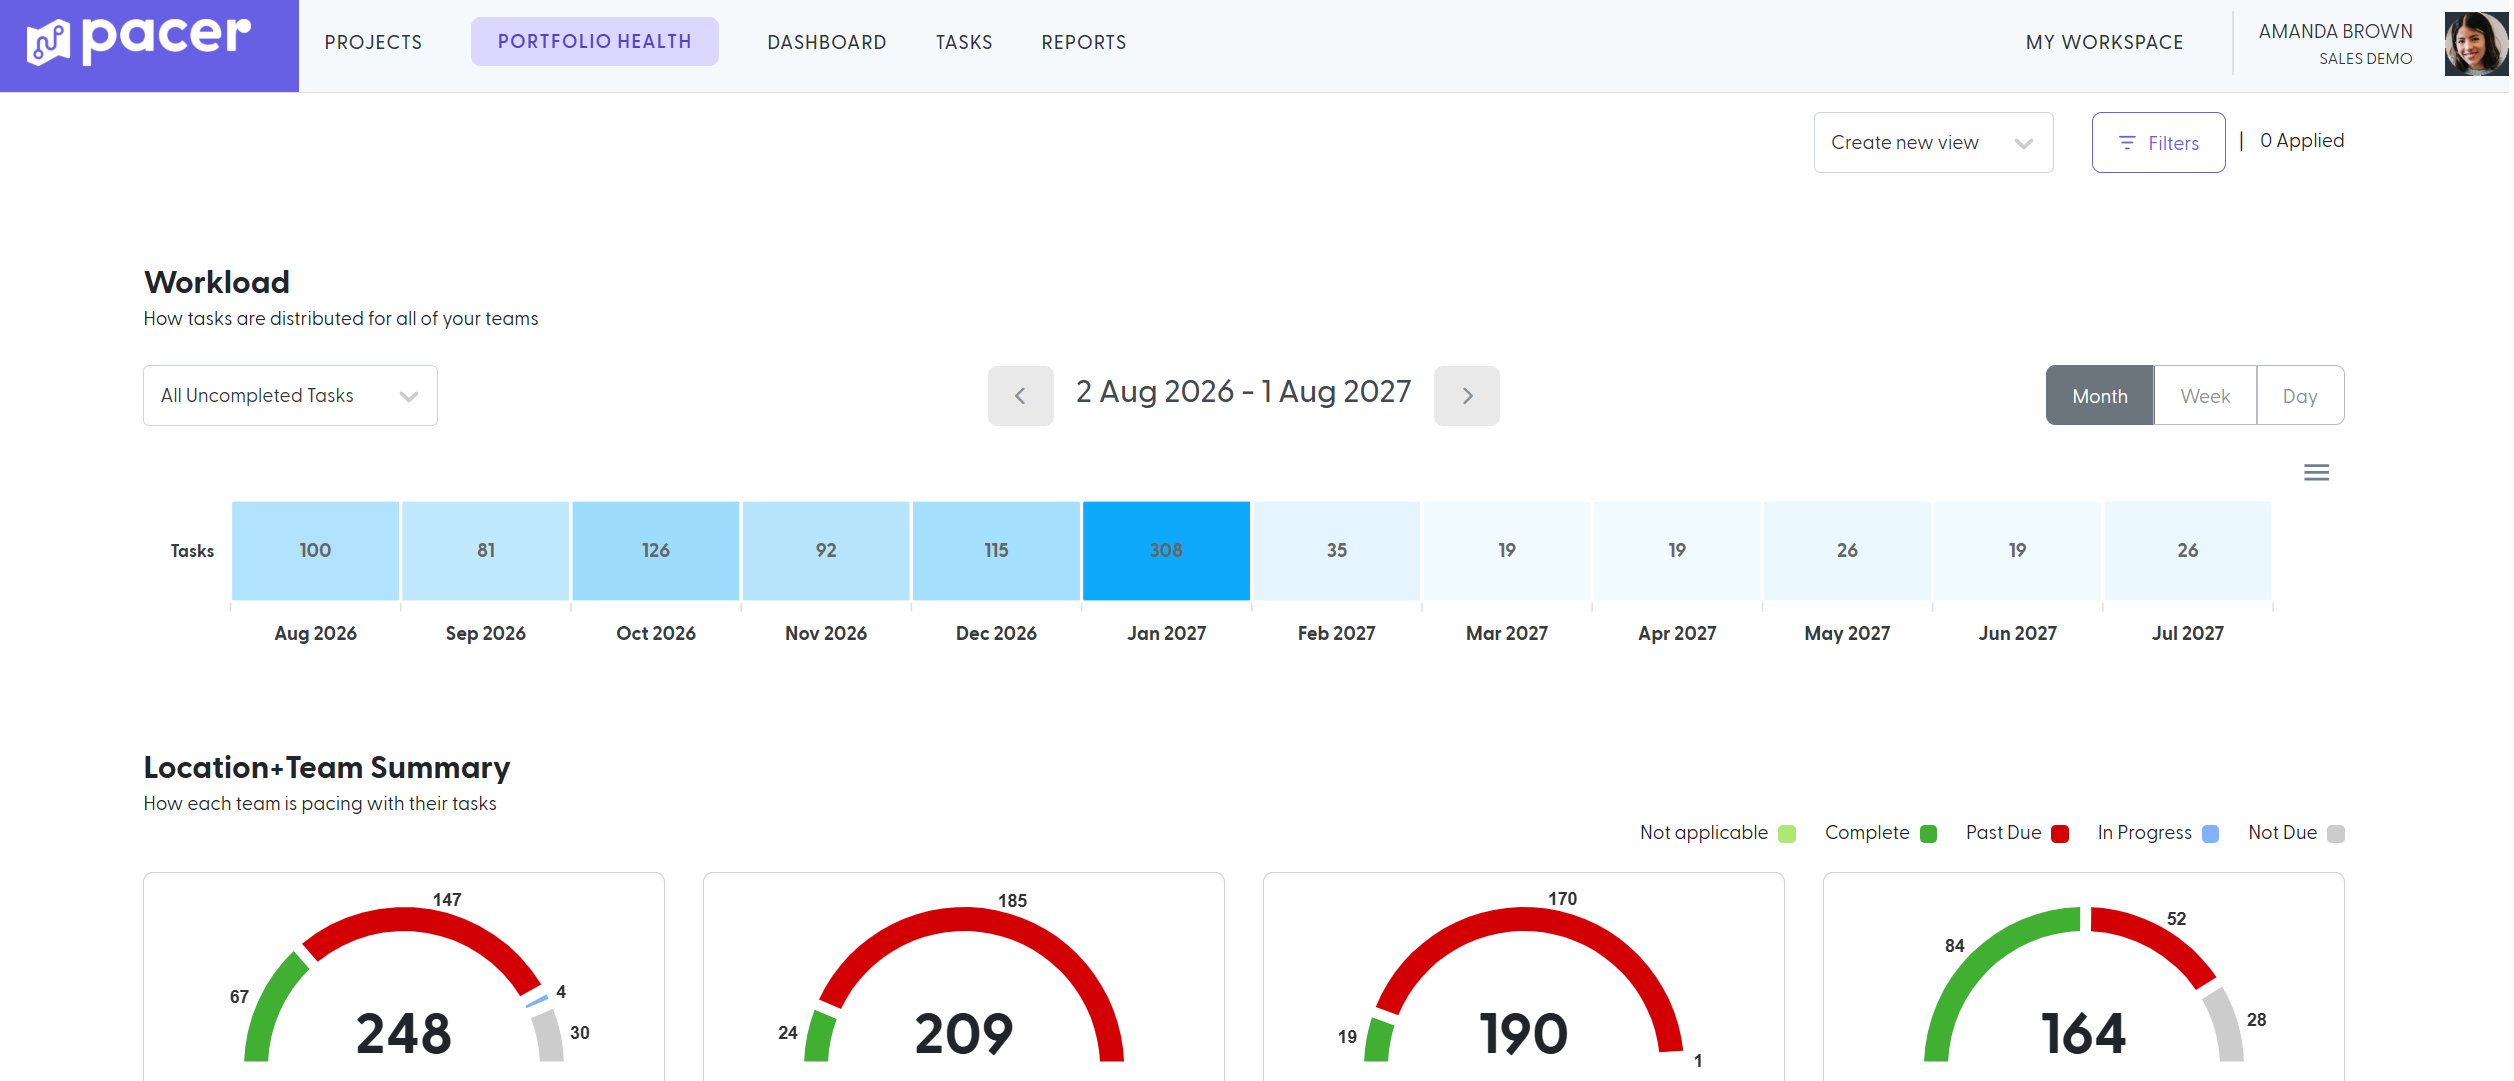
Home, built around the location you work at instead of a catch-all tasklist.
Dashboard is the home page for every general user in Pacer. It shows exactly what belongs to your location, broken down further than a portfolio-level view ever needs to go.Every graph on the page is clickable. See a number, click it, see the tasks behind it.
My Projects
Every project currently assigned to your location: current task, current milestone, key dates, and the PM's contact information, right where you need it. No hunting through an inbox to find who to call.
Overall Rollup
Total progress across every task, in every project, at your location. See it as a whole, narrow it to the departments you've marked as favorites, or narrow it further to only the tasks assigned to you.
Task Breakdown
Slice your tasks by discipline, department, phase, person, or tag. Drill down to exactly the slice you need in seconds, or compare progress between two disciplines, two people, or two phases side by side. This is the widget teams open every day, not once a quarter.
The Next 16 Weeks
Eight weeks behind you, eight weeks ahead, in one graph. See exactly how late a task really is, and see the week coming up that's about to bury your team in to-dos, before it happens instead of during it.
Pace
For a location that hasn't opened yet: your actual week by week completion rate, plotted against the pace you needed to hit opening day. Keep the same pace, and the trend line tells you today whether you open on time, weeks before anyone has to ask.
Financials & Sales Goals
Every task and project at a location tracks budget against actual cost, so you always know where spend stands against what was planned. Set goals for gross revenue, room nights, same-store sales, or whatever the location is chasing, and watch progress track against them right on the page. Financials get a full deep dive of their own elsewhere on the site. Here, it's the fast read on where you stand.
Files
Every file your location has uploaded, in one place. No searching three systems to find the document someone attached six weeks ago.
Nothing to set up. Nothing to maintain.
Create a location, and its Dashboard exists the moment the location does. Inactivate a location, and the Dashboard goes with it. Assign a project to the location or retire one from it, and Dashboard updates itself, same day, no ticket filed. Most tools ask an admin to build a dashboard for every new property, every new project, every new hire. Pacer asks for nothing. The page is already there, already correct, already yours.