
Task Views: One System of Record. Four Ways to See It.
Every role on your team needs to see the work differently. Pacer gives them all one truth, viewed the way they need to see it.
The Problem With One-Size-Fits-All Views
Spreadsheets and generic project tools force everyone into the same rigid grid, whether they are running a single opening, managing a portfolio, or trying to figure out who on the team is buried and who has room to help. Pacer was built differently: every task lives in a single system of record, and every person on your team can view that same task list, calendar, timeline, or workload the way that actually helps them get work done.
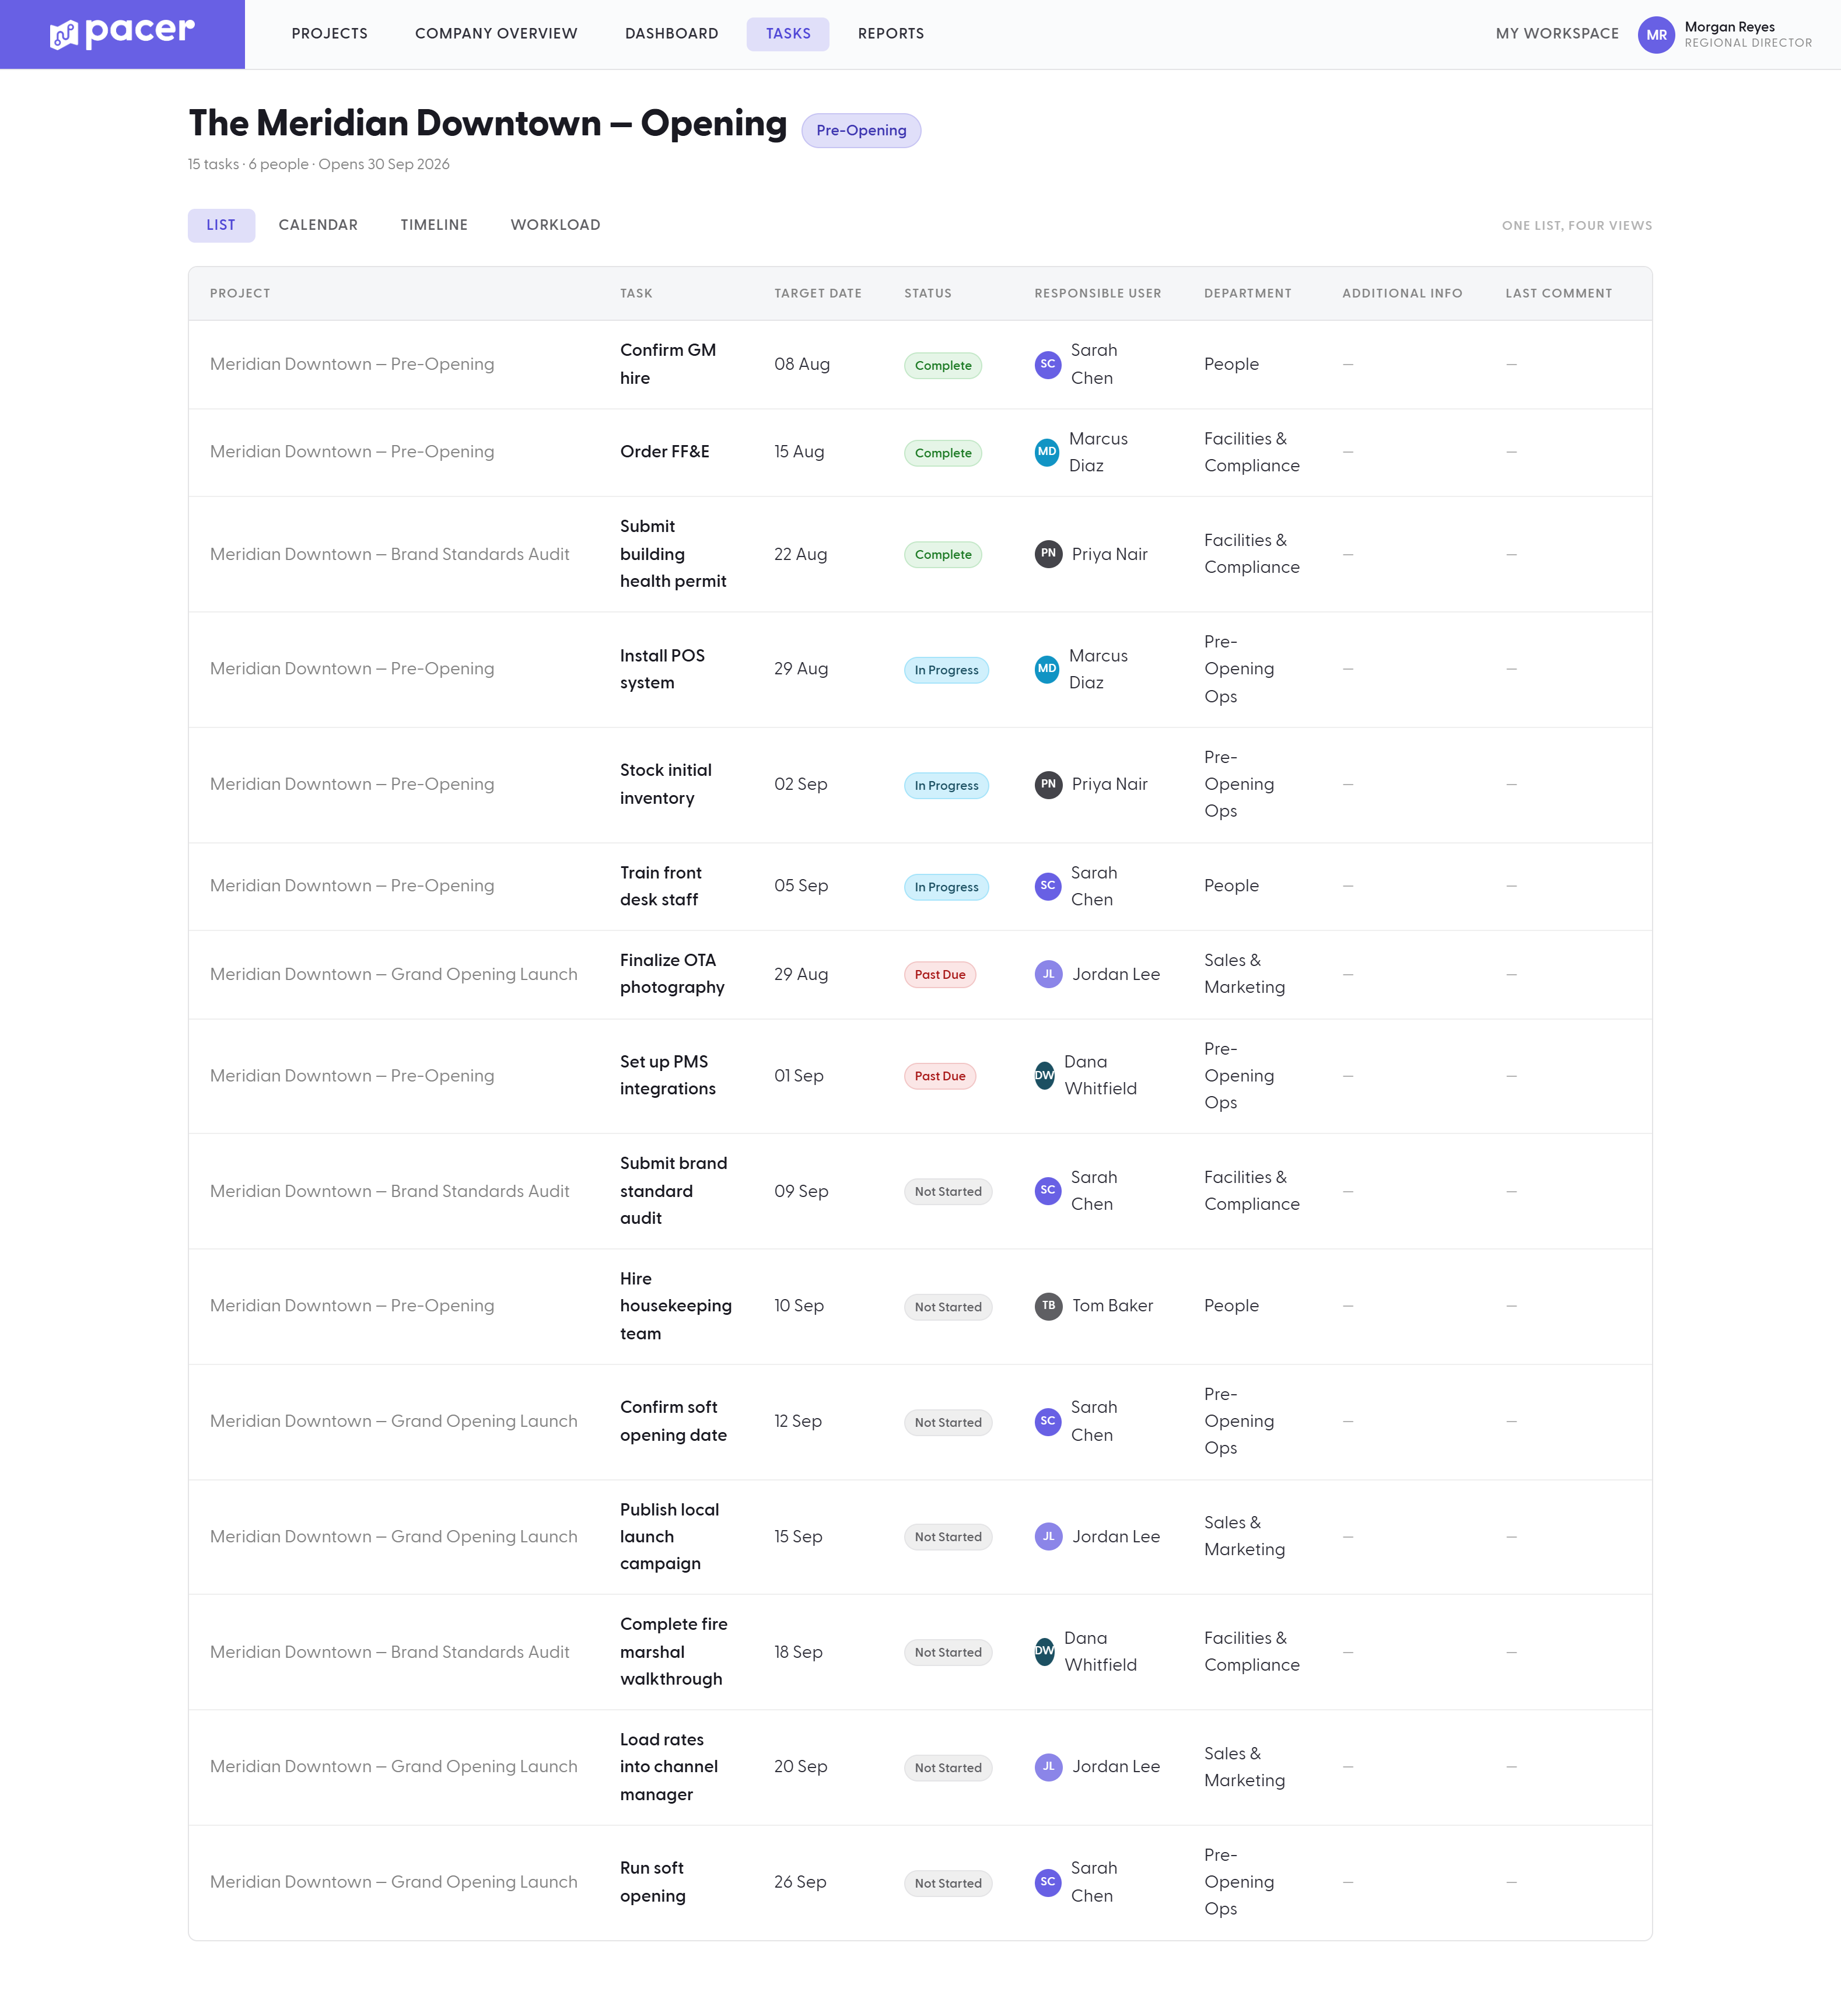
Task List: Work Starts Here, No Training Required
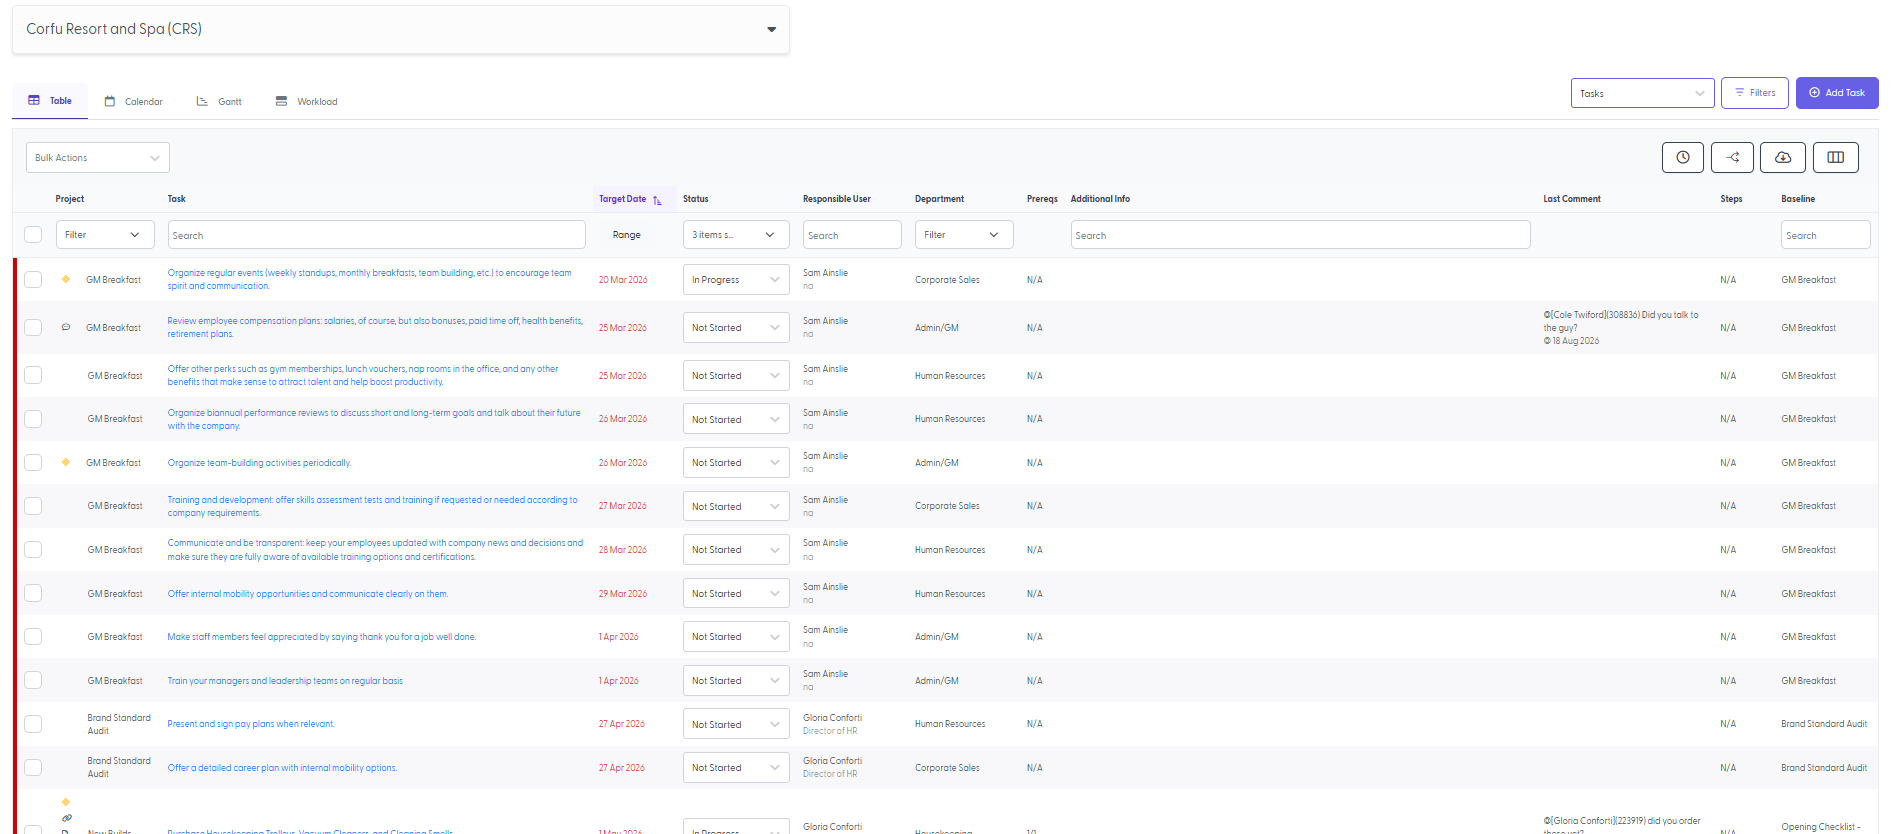
The Task List is the default view for a reason: it is the fastest way to get a new team member productive on day one. It follows the simple rows-and-columns format your team already understands, so there is no learning curve and no reason to fall back on a spreadsheet.
See tasks across one location or every location, filtered instantly by task name, due date, discipline, project, and more. Build the view that matches how you work, customizing which columns appear. Every task is one click from the full detail, with a drawer that surfaces instructions, files, comments, and history in place.
Calendar View: Deadlines, Laid Out in Plain Sight
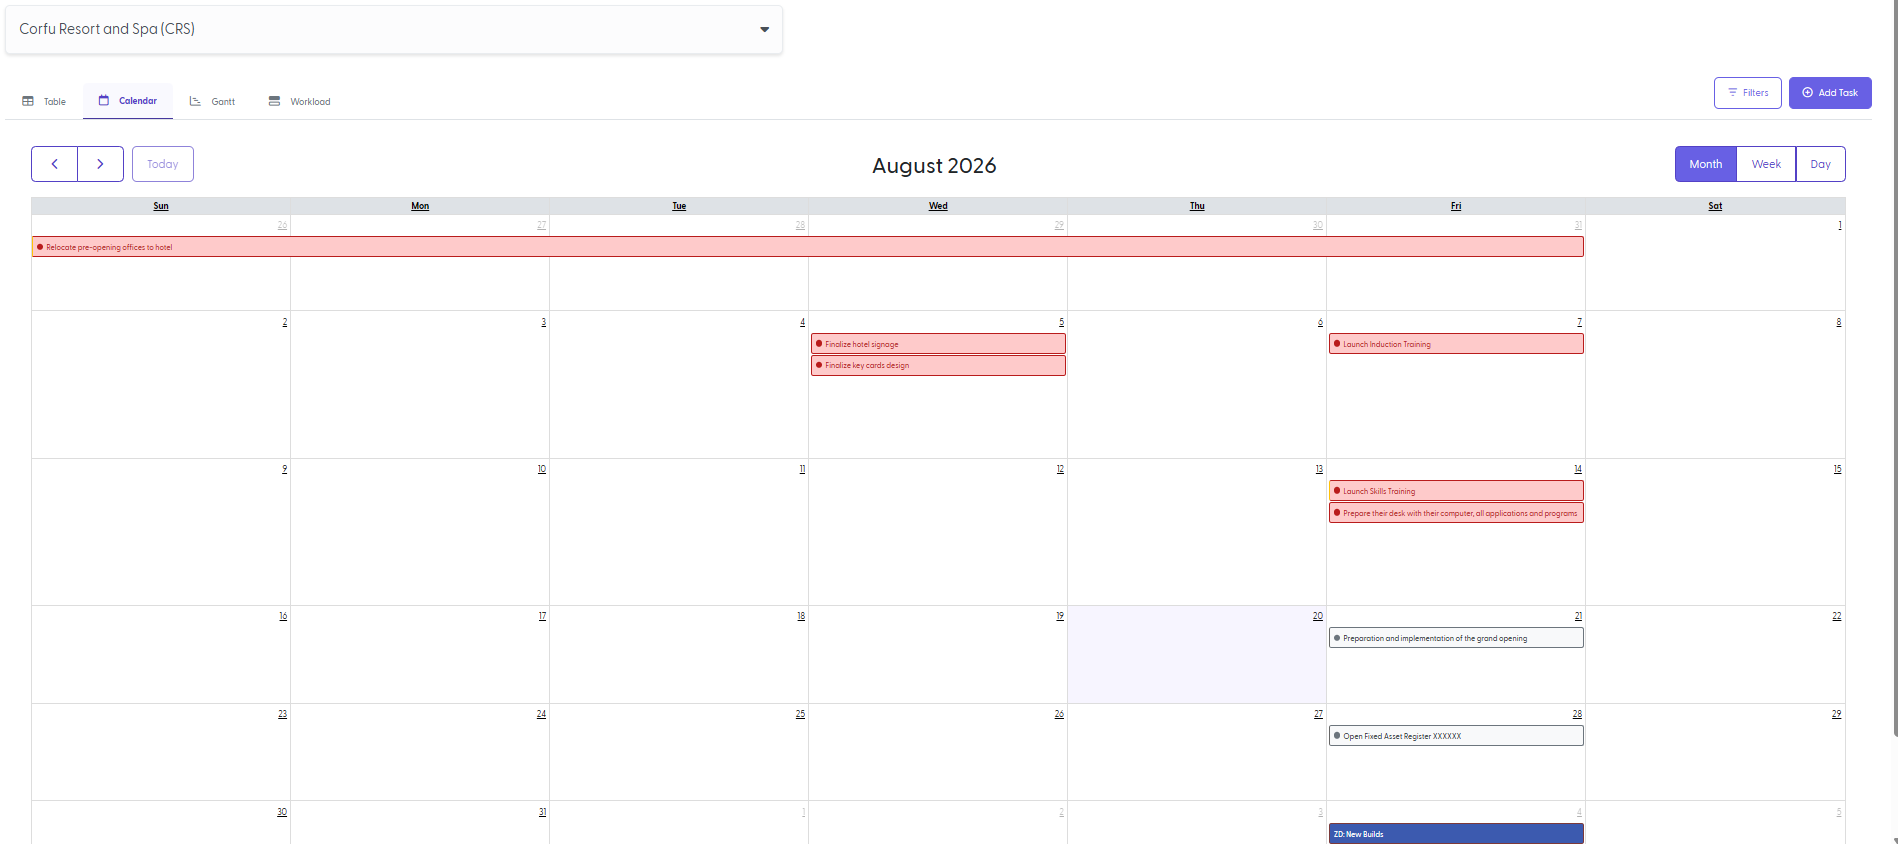
Due dates buried inside a task list are easy to miss. The Calendar View puts every deadline on a monthly grid, so your team can see at a glance what is coming due and where the pressure points sit before they become problems.
- Filter to what matters to you. Narrow the view by project, location, department, or discipline so a location manager sees their month and a regional leader sees theirs.
- Plan ahead, not behind. See what is actually on the calendar, instead of discovering a deadline the week it is due.
No exports, no duplicate spreadsheets, no one working from an outdated copy.
Gantt Chart: Built for the People Who Own the Timeline
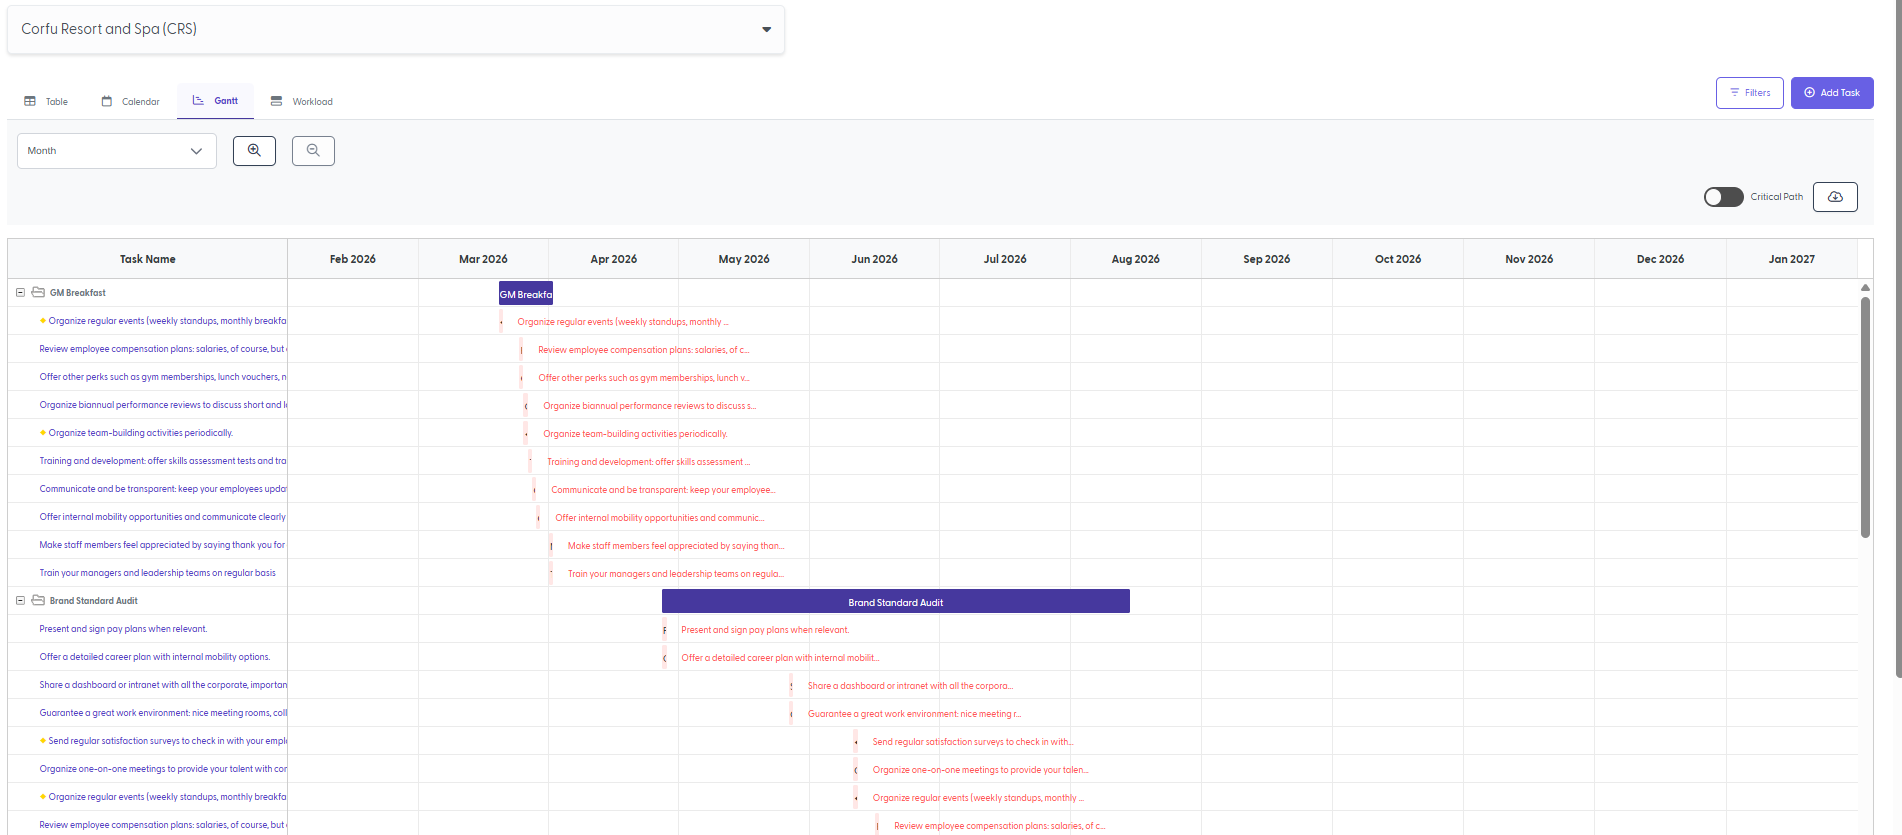
Task List and Calendar tell you what is due. The Gantt Chart tells you how everything connects. See dependencies across tasks, locations, and projects on one timeline, and instantly spot where a slip in one place is about to cause a slip somewhere else.
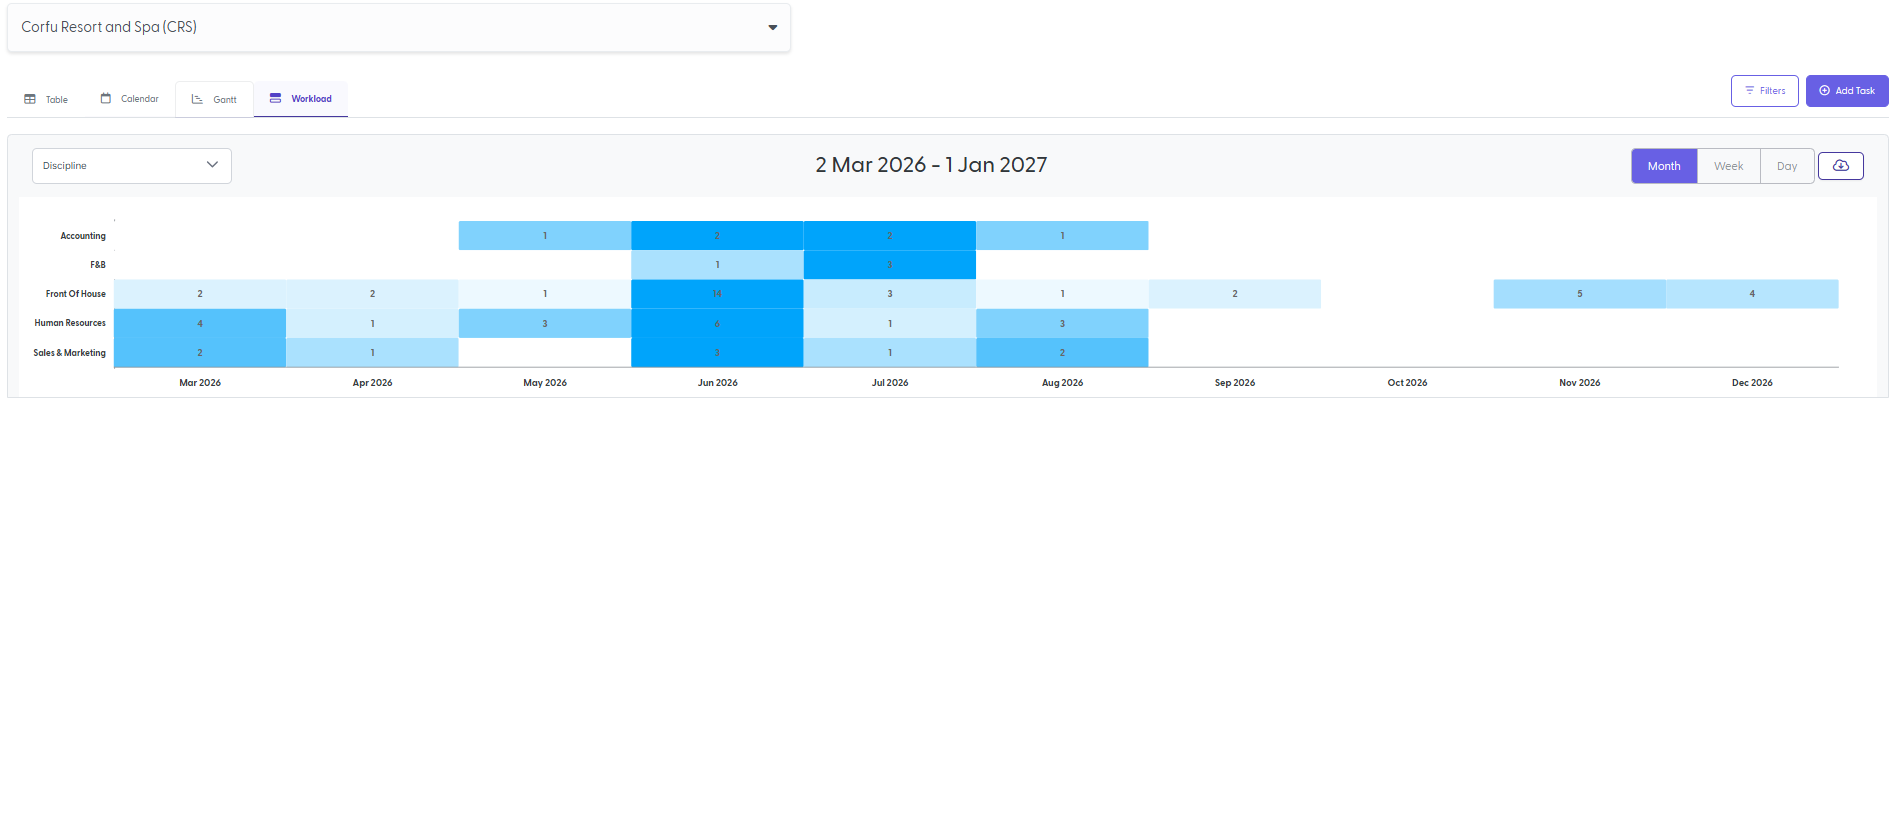
Workload View: See Who Is Buried and Who Has Room
A task list tells you what is due. The Workload view tells you who is drowning. See every person's task count and capacity at a glance, spot the ones who are overloaded before they burn out, and reassign work with confidence instead of a guess. Roll it all the way up to Portfolio Health for the same view across every location at once.
Four Views. One Source of Truth.
Task Views are one part of Pacer, multi-site project management software built for hospitality and franchise operators. See how Pacer works as franchise project management software for openings, transitions, and rollouts.